parcoords#
Parallel Coordinates Plotting for Python
Quickstart#
Install this package through PyPI
pip install parcoords
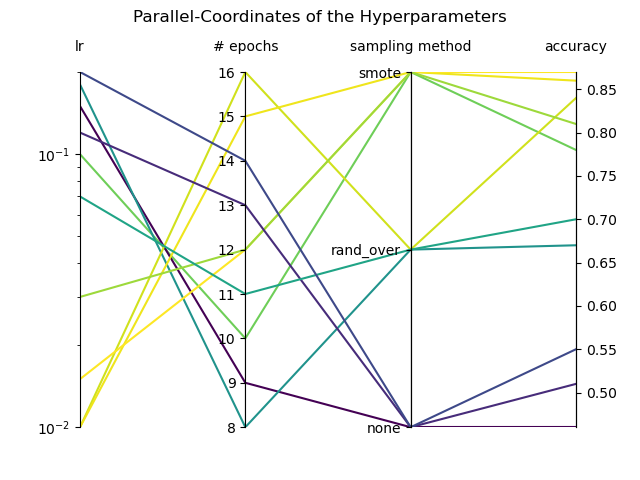
Run the following code snippet, to generate the plot at the top of this page.
import matplotlib.pyplot as plt
from parcoords import plot_parcoords

# let's define some data to plot
values = [
    [0.1, 10, "smote", 0.78],
    [0.15, 9, "none", 0.46],
    [0.18, 8, "rand_over", 0.67],
    [0.01, 16, "rand_over", 0.84],
    [0.01, 15, "smote", 0.86],
    [0.015, 12, "smote", 0.87],
    [0.03, 12, "smote", 0.81],
    [0.12, 13, "none", 0.51],
    [0.07, 11, "rand_over", 0.7],
    [0.2, 14, "none", 0.55],
]

# plot the values as parallel-coordinate plot
plot_parcoords(
    values,
    labels=["lr", "# epochs", "sampling method", "accuracy"],
    color_field="accuracy",
    scale=[("lr", "log")],
    title="Parallel-Coordinates of the Hyperparameters",
)

plt.show()